Earned Value Management is a modern-day technique to measure project performance while integrating schedule, cost, and scope. By using this technique, we can assess if the current cost and progress performance are positive or negative. EVM technique can also be used to forecast Cost at Completion (CAC) and Cost To Complete CTC) for the project.
EVM develops and monitors three key dimensions i.e.
- Planned Value (PV) or Budgeted Cost of Work Scheduled (BCWS)
- PV or BCWS is taken from the approved Cost Baseline of the Project. It is the budget assigned to the planned work.
- Earned Value (EV) or Budgeted Cost of Work Performed (BCWP)
- It is the budget assigned to the work completed.
- Actual Costs (AC) or Actual Cost of Work Performed (ACWP)
- It is the cost incurred in executing the work in this period.
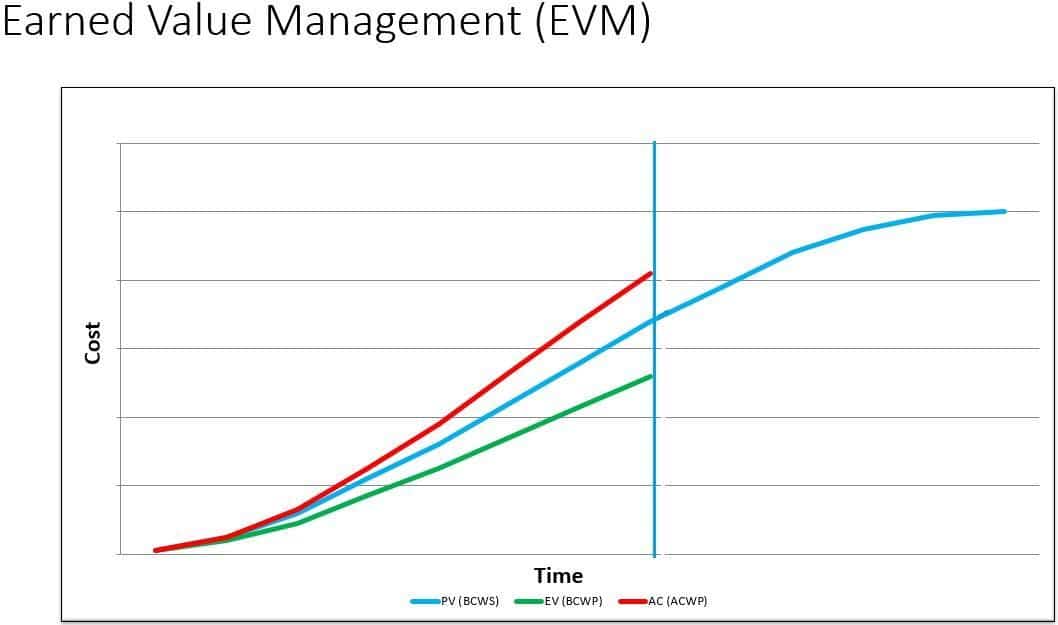
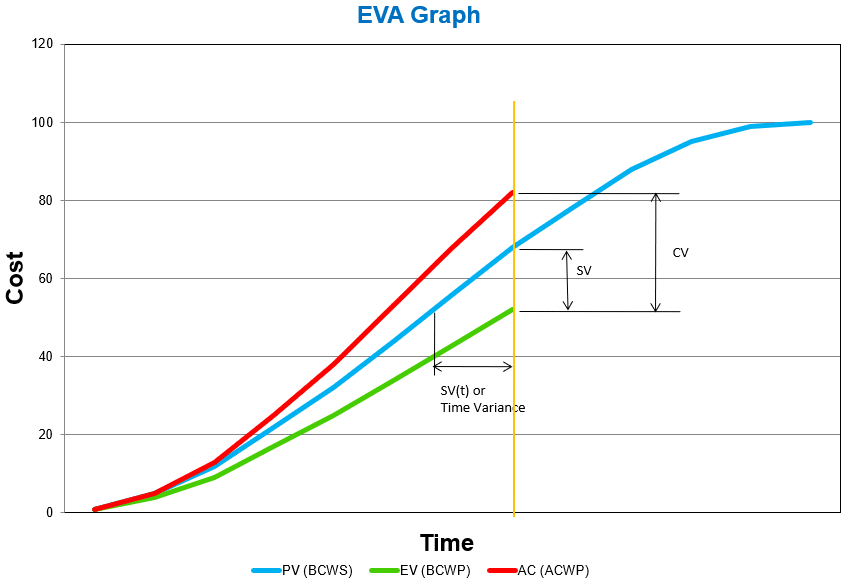
Below is a sample chart used for Earned Value Management (EVM). This chart shows the Planned value (PV or BCWS), the Earned Value (EV or BCWP), and the Actual Cost (AC or ACWP) at a certain point in time (Data Date).

Cost Variance (CV)
- It is the difference between budget allocation against the amount of work done and the actual cost incurred in performing that work. This determines the cost performance of a project.
- It is equal to the earned value (EV or BCWP) minus Actual Cost (AC or ACWP) i.e.
CV = EV – AC or CV = BCWP – ACWP
- Good News: If CV value is positive, the project is currently within budget (spending less than planned for the executed work)
- Bad News: If the CV value is negative, the project is currently exceeding budget (spending more than planned for the executed work)
Cost Performance Index (CPI)
- It is a ratio between budget allocation against work completed (EV) and actual cost (AC). It is a measure of the cost efficiency of work completed and is considered to be the most critical EMV metric.
CPI = EV / AC or CPI = BCWP/ACWP
- Good News: CPI value >1 indicates that progress is achieved with spending less than the budgeted provision for the executed work.
- CPI value =1 means that project spending is the same as in the budgeted provision for the executed work.
- Bad News: CPI value <1 indicates overspending against budgeted provision for the work performed.
Schedule Variance (SV)
- It is a measure of the scheduled performance of a project. It is the difference between the earned value (EV or BCWP) and the planned value (PV or BCWS). i.e.
SV = EV – PV or SV = BCWP – BCWS
- Good News: If the SV value is positive, the project is currently ahead of schedule.
- Bad News: If the SV value is negative, the project is currently behind schedule.
Schedule Performance Index (SPI)
- It is a measure of progress achieved (in terms of cost) against planned progress (in terms of cost). i.e.
SPI = EV / PV or SPI = BCWP / BCWS
- Good News: SPI value >1 means that more work was completed than was planned.
- SPI value = 1 indicates that the project is on schedule.
- Bad News: SPI value <1 indicates that less work was completed than planned.
Schedule Variance % (SV%)
- It is schedule variance in %age of Schedule Variance (SV) of budgeted provision of work scheduled (PV or BCWS). i.e.
SV% = SV / PV or SV% = SV / BCWS
- It represents how much (in %age) is the project ahead or behind schedule.

Example:
Task: Welding of 10 Joints of CS Pipe
- Budget: $100,000 ($10,000 per Joint)
- Time: 10 weeks (1 Joint per week)
After 5 Weeks:
- 4 Joints welded.
- $ 47,500 spent to date.
Now we will start assessing project performance concerning Cost and Schedule as follows:
- PV or BCWS = Joints planned per week x No. of weeks x budgeted cost per joint
= 1 x 5 x 10,000 = $ 50,000
- EV or BCWP = No. of joints completed in 5 weeks x budgeted cost per joint
= 4 x 10,000 = $ 40,000
- AC or ACWP = Actual spending = $ 47,500
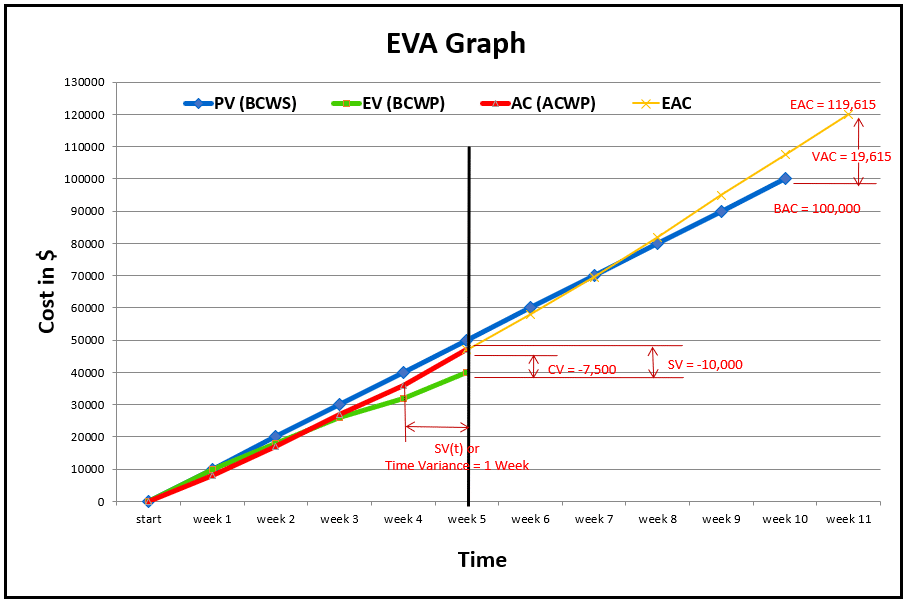
- CV = EV (BCWP) – AC (ACWP) = 40,000 – 47,500 = $ (7,500)
- CPI = EV (BCWP) / AC (ACWP) = 0.84
- CV% = CV / EV (BCWP) = -18.8%
- SV = EV (BCWP) – PV (BCWS) = 40,000 – 50,000 = $ (10,000)
- SPI = EV (BCWP) / PV (BCWS) = 0.80
- SV% = SV / PV (BCWS) = -20%
Note: This SV is in terms of cost. For SV in terms of time (SVt) pl. refer to the EVM graph
Forecasting:
- Forecasting balance cost or Estimate To Complete (ETC) involves making estimates or predictions about the estimate of the remaining costs for the balance work.
- The remaining cost should never be calculated by subtracting Actual Cost (AC) from Budget At Completion (BAC). The Project Team must develop a forecast for the Estimate To Complete (ETC).
- Estimate At Completion (EAC) is calculated by adding Actual Costs incurred (AC) and the estimate to complete (ETC) i.e.
EAC = AC + ETC
Note: Please remember that the Estimate At Completion (EAC) may differ from the budget at completion (BAC).
Variance at Completion (VAC):
- It shows whether the project will end up within or over the budget i.e.
VAC = BAC – EAC
Calculating Estimate To Complete (ETC) and Estimate At Completion:
There are four methods recommended for calculating Estimated Cost To Complete (ETC) as detailed below:
Method #1 – Assuming balance cost is independent of the previous trend:
- Actual costs to date plus a new estimate for remaining work (considering the original plan is no longer valid).
- EAC = AC (or ACWP) + ETC where ETC = Estimate to Complete
Method #2 – Assuming the balance cost will be as per budget:
- Actual costs to date plus remaining budget (current variances are viewed as atypical of future variances)
- EAC = AC + (BAC – EV) Or EAC = ACWP + (BAC – BCWP)
- EAC = 47,500 + (100,000 – 40,000) = $ 107,500
Method #3 – Assuming balance cost will follow the previous trend (CPI):
- Actual costs to date plus the remaining budget modified by the past performance factor i.e. CPI (current variances are viewed as typical of future variances).
- EAC = BAC / CPI = $ 100,000 / 0.84 = $ 119,048
Method #4 (a) – Assuming balance cost shall be affected by CPI and SPI (both):
- Actual costs to date plus the remaining budget modified by both performance factors (CPI & SPI). This formula assumes that future cost performance will be influenced additionally by past schedule performance.
- EAC = AC + [(BAC – EV) / (CPI x SPI)] = 47,500 + [(100,000-40,000)/(0.84×0.80)] = $136,786
Method #4 (b) – Assuming balance cost shall be affected by CPI and SPI proportionately (say 80:20):
- This formula assumes that future cost performance will be influenced jointly in some proportion (say 80:20) by both indices.
EAC = AC + [(BAC – EV) / (0.8CPI + 0.2SPI)] = 47,500 + [(100,000-40,000)/(0.8×0.84 + 0.2×0.80)] = $119,615
Now we will compare the Estimate To Complete (ETC) and Estimate At Completion (EAC) by various recommended methods as follows:
- Method #1 – ETC will be estimated considering the balance of work and ignoring any previous trends. There is no specific procedure or formula recommended for this method.
- Method #2 (Assuming ETC will be as per budget)
EAC = $ 107,000
VAC = (BAC – EAC) = (100,000 – 107,000) = $ (7,000)
- Method #3 (Assuming ETC will be as per budget)
EAC = $ 119,048
VAC = (BAC – EAC) = (100,000 – 119,048) = $ (19,048)
- Method #4a (Assuming balance cost shall be affected by CPI and SPI equally)
EAC = $ 136,786
VAC = (BAC – EAC) = (100,000 – 136,786) = $ (36,786)
- Method #4b (Assuming balance cost shall be affected by CPI and SPI proportionately (say 80:20))
EAC = $ 119,615
VAC = (BAC – EAC) = (100,000 – 119,615) = $ (19,615)
Now we have five different values for Estimate At Completion (EAC). This gives us a range within which we can expect our EAC to be after the project is completed i.e. somewhere between $ 107000 and $ 136,786. Depending upon our choice we can select any value from the above five methods as our Estimate At Completion (EAC) value. Another method can be taking an average of all the calculated values of EAC.
Let’s revisit our EVM Chart by incorporating data that we calculated by Method 4b (say).

To-Complete Performance Index (TCPI):
- It is calculated by dividing ‘remaining work’ by ‘remaining budget’. i.e.
TCPI = (BAC – EV) / (BAC – AC)
or
TCPI = (BAC – BCWP) / (BAC – ACWP)
- In other words, this index shows how efficiently we must use our remaining resources. Using the same example,
TCPI = (100,000 – 40,000)/(100,000 – 47,500) = 1.143
- It means that to complete the project within BAC ($ 100,000), performance must be improved from CPI = 0.82 to TCPI = 1.14 for the remaining work.
Time-Based Schedule Variance – SV(t):
- It is an emerging practice in EVM to use time-based schedule measures as a supplement to traditional cost-based schedule variance.
- It is equal to Planned Time (PT) to Perform Actual Work minus Actual Time (AT). i.e.
SV(t) = PT – AT
- = 4 weeks – 5 weeks = (1) Week
- In the above example, the work performed after 5 weeks (AT=5) had a planned time of 4 weeks (PT=4), which gives
- SV(t) = 4 – 5 = -1 Week
Similarly, SPI(t) = PT/AT = 4/5 = 0.80
The Role of CPM Scheduling in Enhancing Earned Value Management
While Earned Value Management (EVM) provides critical insights into project cost and schedule performance, its effectiveness is notably enhanced when integrated with Critical Path Method (CPM) scheduling. Understanding CPM scheduling is vital for construction project managers, this article on CPM Scheduling in Construction offers a detailed exploration of this method.
CPM scheduling, a cornerstone in project management, assists in identifying the longest path of planned activities to the end of the project and the earliest and latest that each activity can start and finish without delaying the project. This method is essential in defining the Planned Value (PV) in EVM, enabling more accurate and realistic scheduling and budgeting.
Incorporating CPM scheduling into the EVM framework allows project managers to align their schedule performance with cost performance effectively. It provides a comprehensive view of both the timing and cost aspects of the project, enabling more accurate forecasting and decision-making.
Conclusion
Earned Value Management (EVM) is a simple but very effective method of assessing construction project performance concerning cost and budget and also forecasting expected cost at completion (EAC) adopting various recommended approaches. This technique is gaining popularity because of it being user-friendly, quick and accurate results.

